Your custom PC is up and running—but how do you know if it’s operating safely and efficiently? Monitoring your system’s temperatures, voltages, and fan speeds is essential to ensure stable performance, prevent overheating, and extend hardware lifespan.
In this guide, you’ll learn how to set up reliable monitoring, interpret key metrics, and take action when values go out of range.
Why Monitoring Matters
- Prevents overheating of CPU, GPU, and SSDs
- Detects failing components early (like PSUs or fans)
- Ensures stable overclocks and performance tuning
- Helps troubleshoot freezes, crashes, or shutdowns
Best Monitoring Tools for Windows
| Tool | What It Tracks | Cost |
|---|---|---|
| HWiNFO64 | All sensors: CPU, GPU, SSD, voltages | Free |
| MSI Afterburner | GPU temps, clocks, FPS overlay | Free |
| Core Temp | CPU core temperatures | Free |
| Open Hardware Monitor | Open-source temp + fan monitor | Free |
| CPU-Z / GPU-Z | Component identification & sensors | Free |
For Linux Users
- Psensor – Simple GUI for temperature and fan speed
- lm-sensors + fancontrol – Terminal-based monitoring
- GNOME System Monitor – Basic system overview
Ideal Temperature Ranges
| Component | Idle Temp | Load Temp (Safe Max) |
|---|---|---|
| CPU | 30–45 °C | 70–85 °C |
| GPU | 35–50 °C | 75–85 °C |
| SSD | 30–40 °C | ≤70 °C |
| Motherboard | 25–40 °C | ≤65 °C |
Note: Some GPUs and CPUs can handle up to 95°C, but it’s not ideal for long sessions.
Monitoring Voltages: What to Watch
While less common to monitor, voltages matter—especially with overclocking.
| Line | Normal Range |
|---|---|
| +12V | 11.4–12.6V |
| +5V | 4.75–5.25V |
| +3.3V | 3.14–3.47V |
| Vcore (CPU) | 0.7–1.5V |
Warning Signs:
- Large voltage dips or spikes
- Unstable Vcore at idle or under load
- Sudden shutdowns during stress
Use HWiNFO or BIOS to check power delivery health.
How to Read and Control Fan Speeds
Fans are usually reported in RPM (rotations per minute).
- Idle speeds: 600–1000 RPM
- Under load: 1200–2200 RPM (varies by cooler/fan type)
Controlling fans:
- Use BIOS fan curve editor
- Or install FanControl by Rem0o for full software management
- Set profiles for:
- Silent (low fan RPM under 50°C)
- Balanced (gradual ramping)
- Performance (high airflow >70°C)
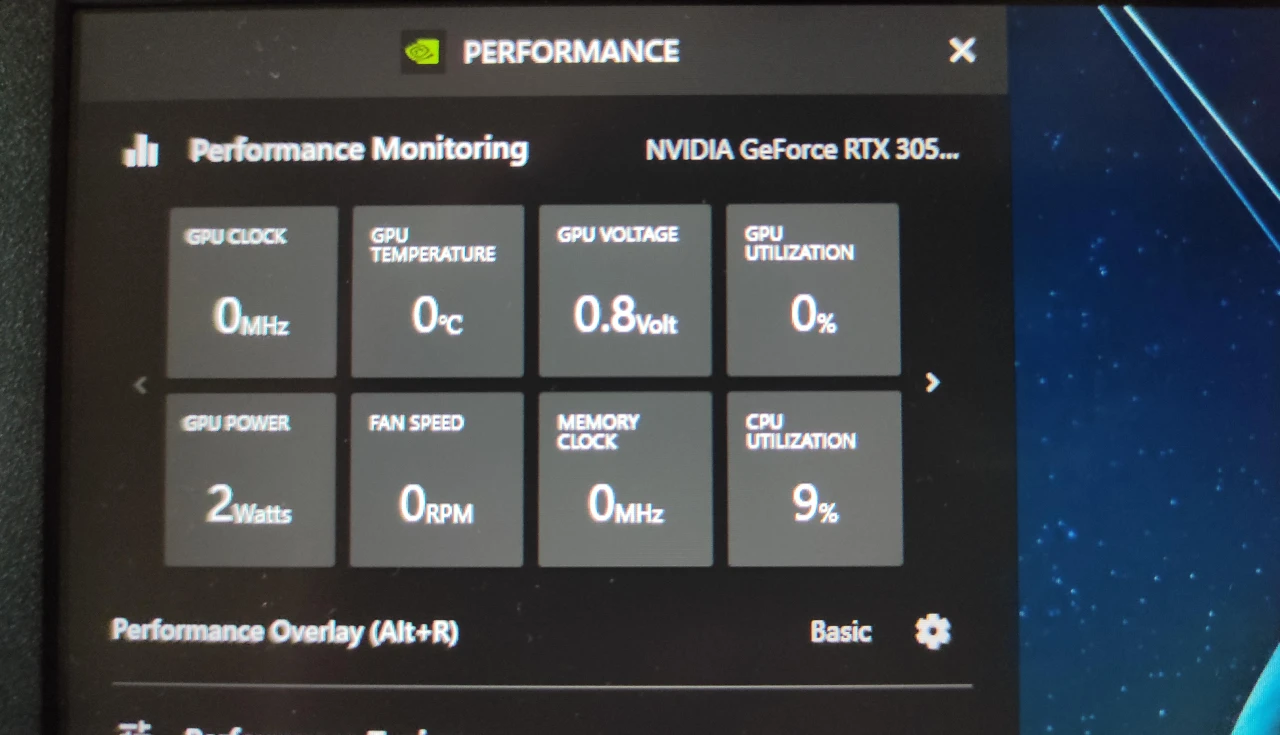
Setting Up an In-Game Overlay (FPS, Temp, Usage)
With MSI Afterburner:
- Install MSI Afterburner + RivaTuner Statistics Server (RTSS)
- Open Settings > Monitoring tab
- Enable sensors like:
- GPU temperature
- CPU usage
- RAM usage
- FPS
This lets you track performance and thermals while gaming.
Stress Testing for Monitoring
To test real-world temps and voltages, use:
| Tool | Component | Duration |
|---|---|---|
| Prime95 | CPU | 15–30 mins |
| AIDA64 | Full system | 30+ mins |
| FurMark | GPU | 10–15 mins |
| 3DMark Time Spy | All-around | One run |
Watch for:
- Temps exceeding safe limits
- Loud fan ramps
- System instability or shutdowns
Maintenance Tips Based on Monitoring
- If temps are too high:
- Clean fans and heatsinks
- Replace thermal paste (if old)
- Improve case airflow
- If fan speeds are erratic:
- Reset BIOS
- Replace faulty fans
- Check for sensor issues
Wrapping Up: Data = Prevention
Monitoring your system is more than just numbers—it’s how you prevent damage, ensure performance consistency, and detect early warning signs. Set up your tools, understand your ranges, and review logs regularly.
Próximo da Fila
“How to Properly Shut Down, Sleep, or Hibernate Your PC (And When to Use Each)”
How to Monitor Temperatures, Voltages, and Fan Speeds the Right Way
Keeping a close eye on your system’s vital signs is essential for maintaining performance, ensuring stability, and avoiding hardware damage. Here’s how to monitor temperatures, voltages, and fan speeds with precision.
Top Monitoring Tools
Windows
- HWiNFO64 – Comprehensive sensor readouts (CPU, GPU, SSD, voltages) securitygladiators.com+2timedoctor.com+2ms.codes+2
- MSI Afterburner + RTSS – GPU temps, fan profiles, FPS overlay ms.codes
- Core Temp – Detailed CPU core temperature tracking
- HWMonitor – Intuitive reporting of temperature, voltage, fan speeds screenrant.com+5securitygladiators.com+5timedoctor.com+5
- Open Hardware Monitor – Open-source, simple overview
Linux
- Psensor, lm-sensors + fancontrol, GNOME System Monitor
Ideal Temperature Ranges
| Component | Idle Temp | Safe Load Max |
|---|---|---|
| CPU | 30–45 °C | ≤ 85 °C |
| GPU | 35–50 °C | ≤ 85 °C |
| SSD | 30–40 °C | ≤ 70 °C |
| Motherboard | 25–40 °C | ≤ 65 °C |
Peaks above these values may harm lifespan and performance.
Voltage Monitoring
While typically stable, monitor these key rails:
- +12 V: 11.4–12.6 V
- +5 V: 4.75–5.25 V
- +3.3 V: 3.14–3.47 V
- CPU Vcore: 0.7–1.5 V
Irregular spikes indicate PSU issues—use BIOS or HWiNFO for checks.
Fan Speed Settings
- Idle RPM: 600–1000
- Load RPM: 1200–2200+
Use BIOS or FanControl by Rem0o to optimize curves: - Silent Mode (up to 50 °C)
- Balanced (50–70 °C ramping)
- Performance (max airflow >70 °C)
In-Game Monitoring Setup
Using MSI Afterburner + RTSS:
- Select metrics in Afterburner > Monitoring
- Enable “Show in On-Screen Display” for: FPS, CPU/GPU temps, usages
- Tweak overlay positioning and look
This real-time feedback helps identify thermal/full-load conditions during gameplay.
Conducting Stress Tests
| Tool | What It Tests | Recommended Duration |
|---|---|---|
| Prime95 | CPU | 15–30 minutes |
| AIDA64 | Whole system | 30+ minutes |
| FurMark | GPU | 10–15 minutes |
| 3DMark Time Spy | GPU/CPU combination | One benchmark run |
Watch for temperature spikes, fan behavior, voltage drops, or shutdowns.
Maintenance Based on Insights
- High temps → clean dust, reapply thermal paste, boost airflow
- Fan issues → remap curves, replace faulty fans
- Voltage instability → check PSU health or cables
Summary
- Install reliable monitoring tools
- Track key metrics and know healthy ranges
- Create overlay for live data during usage
- Stress test to validate stability
- Take action based on collected data
By doing this, you’re not just observing—you’re proactively ensuring your PC’s safety, performance, and reliability.